
An analysis on Printing and circulation of Paper Money – 3
-Analysis-
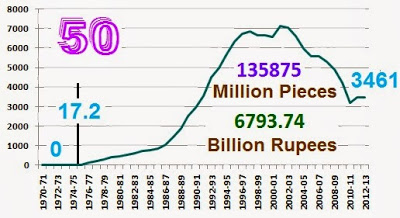
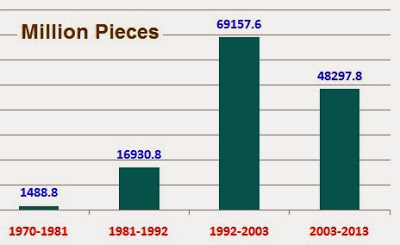
printed and issued in a span of 43 years i.e from 1970 to 2013. The
second graph (volume in million pieces) shows the same
trend of issue/ circulation every 10 years
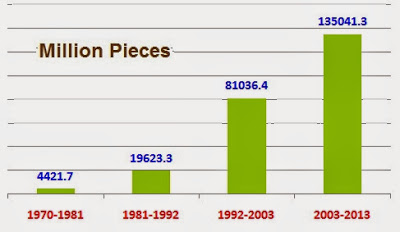
Total quantum of Rs 50/- denomination Bank Notes issued/circulated in 43 years (1970-2013) have been 135875 million pieces. If we keep the first 10 years issue figures as base, then the position of issue/circulation works out as below:
(i) Increase in the issue/circulation by 11 times in the next 10 years i.e 1981-1992
(ii) During 1992-2003 increase in issue/ circulation by nearly 4 times compared to 1981-92 issues
(iii) Marginal decrease in issue/ circulation in the next ten years i.e 2003-2013 to the extent of 31 % compared to previous ten years.
Though the printing and fresh issue of this denomination was higher in the period 1992-2003, the reason for sudden decrease in share of this denominational issue in 2003-2013 is unclear. It could be due to higher percent of circulation in Rs 100/- deno and Rs 500/- denominations during the said period.
Bank notes to the extent of only 3461^^ million pieces (8.51 billion) of Rs 50/- denomination are in circulation in the year 2012-2013 which works out to 2.54 % of the total notes issued in 43 years (^^Ref:- Database on Indian Economy/ RBI Data Warehouse: Table 159 : Notes and Coins Issued).
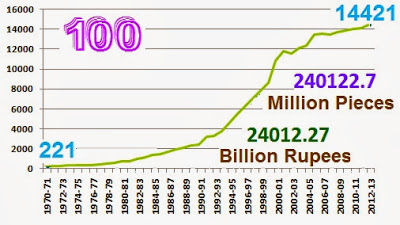
printed and issued in a span of 43 years i.e from 1970 to 2013. The
second graph (volume in million pieces) shows the same
trend of issue/ circulation every 10 years
As for Rs 100 /- denomination whose printing has also been discontinued from the year 2005, the total quantum issued/circulated in 43 years (1970-2013) have been 240122.27 million pieces of notes. If we keep the first 10 years issue figures as base, then the position of issue/circulation works out as below:
(i) Increase in the issue/circulation by nearly five times in the next 10 years i.e 1981-1992.
(ii) During 1992-2003 the issue/ circulation of this denomination further increased by nearly 4 times compared to 1981-92 issues.
(iii) Increase in the next ten years i.e 2003-2013 by 1.66 times compared to previous ten years.
Bank notes to the extent of only 14421^^million pieces of Rs 100/- denomination are in circulation in 2012-2013 which works out to 6 % of the total notes issued in 43 years (^^Ref:- Database on Indian Economy/ RBI Data Warehouse: Table 159 : Notes and Coins Issued).
In the graphs shown above** (1) show the total Volume and Value of notes
printed and issued in a span of 43 years i.e from 1970 to 2013. The
second graph (volume in million pieces) shows the same
trend of issue/ circulation every 10 years
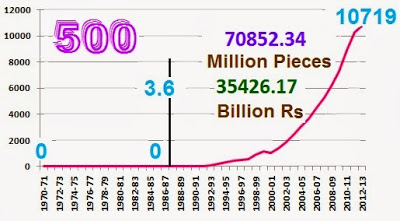
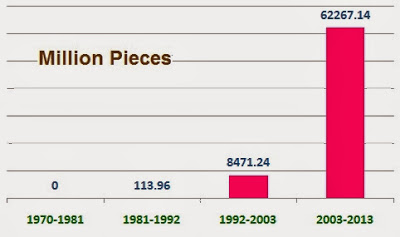
As for Rs 500 /- denomination whose printing has also been discontinued and re introduced at intervals, the total pieces issued in 43 years (1970-2013) works out to 70852 million pieces of notes. If we keep the first 10 years (1981-1992) issue figures as base, then the position of issue/circulation works out as below as this denomination has not been issued till 1987- 1988:
(i) It was nil during 1970 to 1981 .
(ii) The issue/ circulation began during 1981-1992.
Bank notes to the extent of only 10719^^million pieces of Rs 500/- denomination are in circulation in 2012-2013 which works out to 15 % of the total notes issued in 26 years. (^^Ref:- Database on Indian Economy/ RBI Data Warehouse: Table 159 : Notes and Coins Issued).
printed and issued in a span of 43 years i.e from 1970 to 2013. The
second graph (volume in million pieces) shows the same
trend of issue/ circulation every 10 years
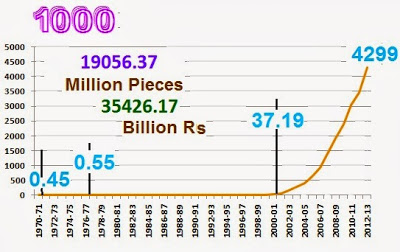
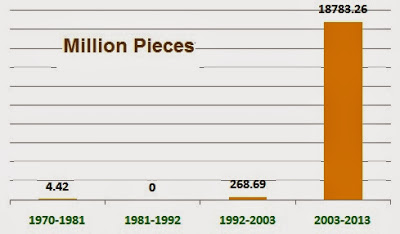
As for Rs 1000 /- denomination the total pieces issued in 43 years (1970-2013) have been 19052 million pieces of notes. If we keep the first 20 years (1970-1992) issue figures as base, then the position of issue/circulation works out as below:
(i) It was just total 4.42 million pieces during 1970 to 1992, and therefore it can not be taken as yardstick to correctly compare with succeeding year circulation .
(ii) In view of the above if we keep the base year for calculation as 1992-2003 the raise in circulation is almost 70 times times in the next 10 years i.e 2003-2013.
Now in 2012-2013 Currencies of this denomination remains in circulation to the extent of only 4299^^million pieces works out to mere 22.56 % of the total notes issued/circulated in 21 years (^^Ref:- Database on Indian Economy/ RBI Data Warehouse: Table 159 : Notes and Coins Issued).
Rs 1000 , Rs 5000/- and Rs 10000/- in circulation prior to independence in limited quantity. In the year 1946 Rs 1000/- and Rs 10000/- denominations were demonized to curb unaccounted money. Again all the three denominations i.e Rs 1000/-, Rs 5000/- and Rs 10000/- were reintroduced in the year 1954 put in circulation but again they were demonetized twice in the year 1978. (Ref: Frequently asked questions under Chapter Currency: http://www.rbi.org.in/scripts/FAQ).
In the said three higher denominational Bank Notes, Rs 1000/- deno was re-introduced in the year 2000. Prior to issue of Rs 1000/- , a newer denomination in the value of Rs 500/- was introduced in the year 1987-88. Therefore the data has been compiled only from 1970 onwards by not taking into consideration the demonetized issues of Rs 1000/- denomination which was very limited in circulation prior to 1970.
————————
{** Courtesy :- The Graphic representations shown for Rs 50/-, 100/-, 500/-, to Rs 1000/- denominations have been prepared on the basis of the Data taken from RBI site:- ”Database on Indian Economy/ RBI Data Warehouse: Table 159 : Notes and Coins Issued” )
—————————-





Recent Comments